Foreword
Scalping is a fast-paced, short-term trading strategy that seeks to profit from very small price movements with assets, such as Forex pairs or indices. Scalpers, also known as high-frequency traders, rely significantly on specific scalping trading indicators to identify very fast key entry and exit points to take advantage of volatility and brief market inefficiencies. A breakdown of the Top 5 Scalping Trading Indicators, which outlines how these indicator tools can help Indian traders time their fleeting, explosive trades for the most overall profit, is provided in this guide.
Top 5 Scalping Trading Indicators for Precision Trading
Because scalping is fast-paced, indicators must be very responsive to small changes in price. Below are five of the most effective indicators for timing entry or exit points for quick buy and sell trades.
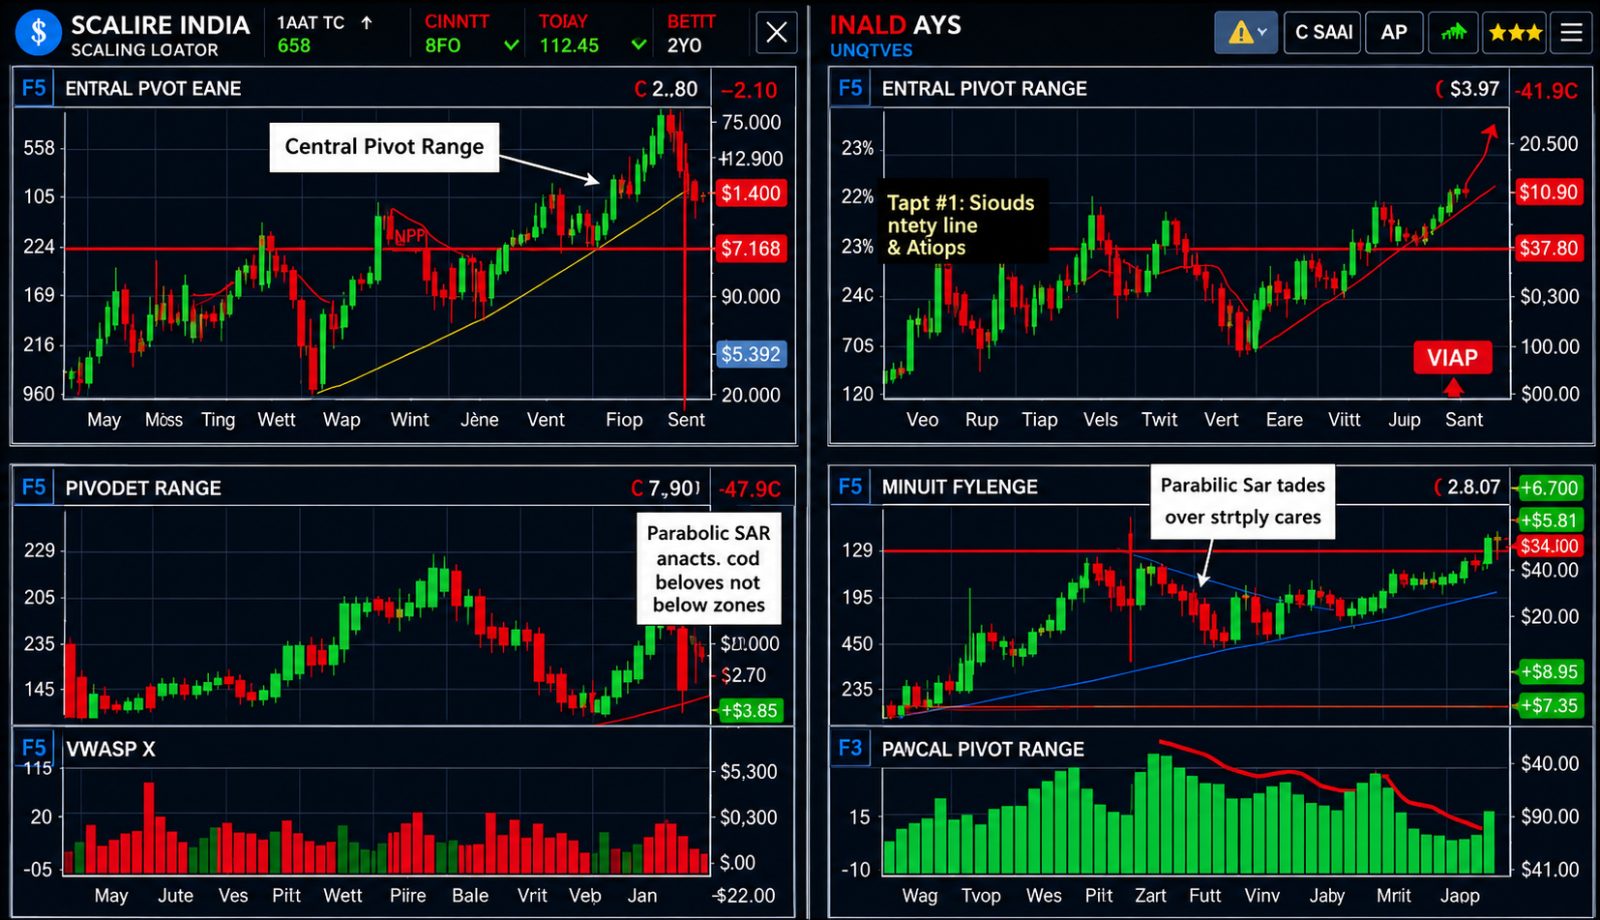
1. Central Pivot Range (CPR)
The Central Pivot Range (CPR) is a leading indicator that establishes the primary intraday support and resistance structure. It is based on the previous day's High, Low and Close values.
Strategy Idea: The CPR can be used to gauge whether the market is expected to trend or be range bound.
Range Bound Play: If price opens inside the CPR (above the Bottom Central (BC) and below the Top Central (TC)), the market is likely consolidating. In this case, scalpers will look for rapid trades within the TC and BC.
Entry/Exit: When price breaks above the BC, it could be a quick buy entry, indicating price has strength. Target the TC as a price objective. If selling, price could reach the TC and be a possible sell entry, targeting the BC. Enter trades with no designation at brief targets before price reaches TC or BC.
2. VWAP (Volume-Weighted Average Price)
VWAP gives a balanced perspective of price action, as it is based on both price and volume data and provides a baseline for the asset's true average price at any point in the day.
Strength of the Signal: A breakout above or below VWAP with a strong volume-driven price activity is usually an indication of a substantial and confident intraday move in that direction.
Trade Strategy: Scalpers will establish trades in the direction of the breakout only after it has occurred and volume drives the price action.
Risk Management: VWAP can usually serve as an effective trailing stop or a mean-reversion area for scalpers. If a price move comes too far from VWAP, scalpers will look for a quick reversal position back towards the VWAP mean.
Confirmation: Make sure to confirm the VWAP breakout with an additional momentum confirmation (i.e. RSI, MACD, dent). This confirmation can assist and lower the false breakout rate of the VWAP direction.
3. Parabolic SAR (Stop and Reverse)
The Parabolic SAR is a trend-following indicator that displays dots below or above the price bars to identify possible trend reversals and optimal exit points.
Bullish Signal (Entry): A buy signal is generated when the SAR dots switch from being above the price bars to below the price bars, indicating a shift from bearish momentum to bullish momentum.
Bearish Signal(Entry): A short signal is generated when the dots switch from being below the price bars to above the price bars, indicating a potential shift to bearish momentum.
Exit & Trailing Stop: The SAR dots are perfect for trailing your stop-loss by tightening the stop as the trend continues, thus protecting your profits. Exit the trade immediately when the SAR dots switch direction (for instance, when you are long, the dots switch from below the price to above the price).
4. Relative Strength Index (RSI)
The Relative Strength Index (RSI) is a widely-used momentum oscillator that detects overbought and oversold situations. It needs to be personalized for scalping due to the speed of trade.
Personalization: Scalpers adjust RSI lower (typically from a 14 period default to 7or 9 periods) to increase the responsiveness of the indicator to quick и price movements on 1- or 5-min charts.
Trade strategy: Watch and look for a sharp move up into the RSI overbought area (70 or higher) or down into the oversold (30 or lower area). This is typically a momentary move of price exhaustion and an opportunity to buy/sell on a counter trend as a scalper.
Time frame: Work only with RSI on the 1- or 5-min chart, since scalping is fast and short-term based trading.
5. MACD (Moving Average Convergence Divergence)
The MACD is a momentum indicator that detects changes in an asset's momentum by comparing two moving averages. It's often used to find the precise entry and exit timing.
Strategy: Watch for a crossover between the MACD line and the Signal line for a high-probability buy or sell signal.
Bullish Signal (Buy): Buy as soon as the MACD line crosses above the Signal line (bullish crossover).
Bearish Signal (Sell): Sell when the MACD line crosses below the Signal line (bearish crossover).
Exit Signal: You may want to exit the trade when the MACD lines start to flatten and/or cross back, which can indicate that momentum is gone and the trend may reverse.
Final point
To become proficient in scalping, it is important to internalize the reality that even the most reliable indicators are never guaranteed, but profitability comes from utilizing different indicators (CPR, for context; RSI/MACD, for timing, etc.) on ultra-short timeframes. The bottom line is that becoming proficient in scalping requires the combination of technical indicators, strict position sizing and unwavering risk management that keep your numerous small losses small and your numerous small winning trades add up to a meaningful profit.