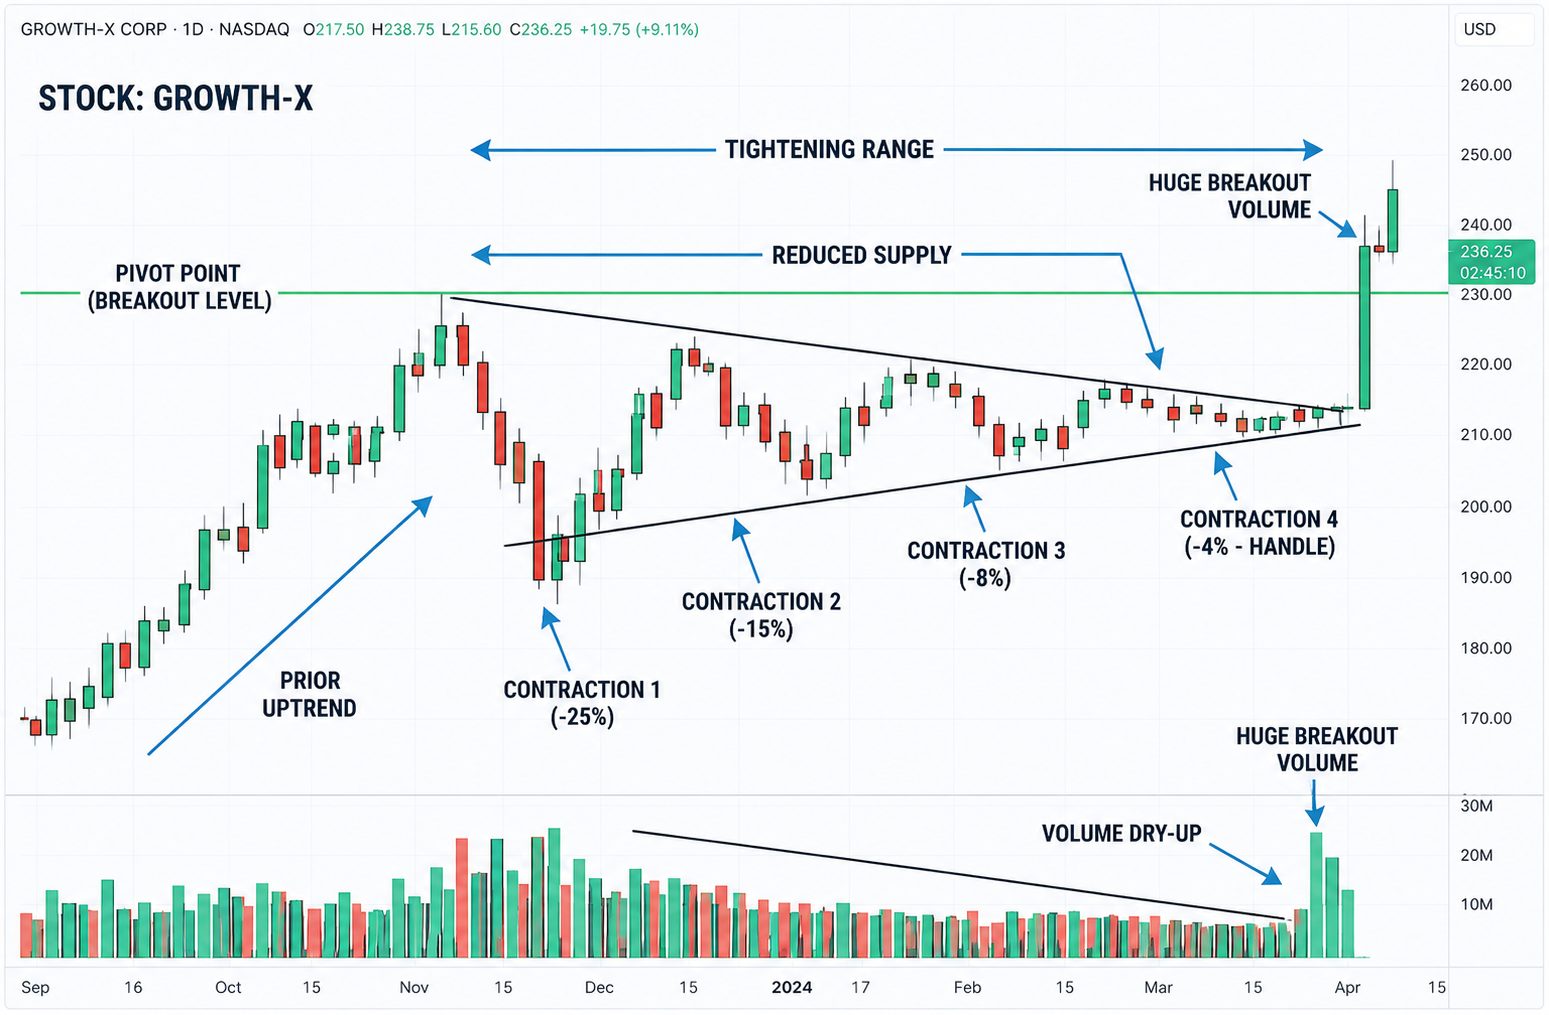
Foreword The Volatility Contraction Pattern (VCP) is the unique chart pattern championed by trader Mark Minervini, with the primary goal of identifying the exact point at which a high-growth stock is ready for a big move. The idea is simple yet powerful: market volatility and volume dry up and selling pressure subsides, creating a "line of least resistance" prior to a coming breakout. For traders on any Forex or stock platform, gaining an understanding of VCP is key to effectively determining a setup, as it provides a systematic means of entering trades exhibiting high momentum with the tightest possible risk, an all in one setup. In this article, we will explore and deconstruct the anatomy, psychology, and practical ways to find and capture VCP setups. The VCP is a correction pattern that usually occurs in stocks that are already in a robust uptrend (Minervini’s Stage 2), a "pause that refreshes" before the next explosive advance. It provides a visual depiction of the transition from high supply to low supply as institutional investors gradually accumulate shares. The VCP is characterized by four key characteristics that indicate decreasing selling pressure and incoming demand. The most essential aspect of the VCP is the unmistakable decline in the price range of modest pullbacks. Principle: Each modest pullback (or, "contraction") is lesser than the previous pullback (i.e., drop from 25% to 15% to 8% decline). The continually diminishing pullbacks denote that selling pressure is diminishing. Symmetry and Structure: A quality VCP typically structures itself into 2-6 modest pullbacks, where a symmetrical "base" is formed and continually tightens from left to right. This type of structure indicates stocks are being selectively accumulated. In conjunction with market price contractions, trading volume should undoubtedly decline. The Signal: As volume decreases during the contractions, it implies limited sellers are actually participating; therefore, the supply of the stock available to buy is decreasing. Market Preparation to Breakout: This Volume Dry-Up (VDU) prepares a breakout, since it takes just a small amount of purchasing demand into the market to materially push the stock price higher from the current price level. The VCP concludes at the pivot point—which is also the entry point. Tight Range: The pivot point is also where price is at its tightest range, and volume is at or near its lowest. Entry Confirmation: A confirmed buy signal occurs when the stock convincingly breaks the pivot point on an immediate and significant increase in volume. Trading the VCP proficiently needs a structured, step-by-step process concentrating on timing and risk management. 1. Identify the Trend (Stage 2): The first step is screening for stocks in a strong, established uptrend (Minervini's Stage 2), as the VCP works best as continuation patterns. 2. Check the Contractions and Volume: Manually check the chart to ensure the price swings are clearly getting smaller (i.e.,3-4 clear contractions over 6 to 12 weeks), and confirm that the volume levels are as small as possible. 3. Check the Tight Base: The final contraction has to be very tight price action where the volume is at a minimum level, which means there is very low supply just before the pivot. Enter at the Breakout: Wait for the stock to break above the pivot point with a significant increase in volume (ideally 30-40%+ above the average volume). The increase in volume indicates institutional buying, which validates the breakout overall. Manage Risk Immediately: The VCP pattern structure is advantageous for risk-reward because you're able to set a very specific stop-loss due to the tightness factor associated with the VCP structure. You can set your stop-loss order just below the low of the last contraction or around 5-8% from the entry pivot. Favorable Risk/Reward: A tight stop-loss typically means an excellent risk-to-reward ratio (often 3:1 or better), or you can risk $1 to make $3+. Essentially you're putting less at risk for potentially high reward. The VCP's strength exists in a change in market psychology which makes it distinct from other common patterns: This pattern is indicative of seller exhaustion and buyer confidence building: 1. Seller Exhaustion: in the initial sharp pullbacks, weak holders shake out. As "smart money" accumulates shares, subsequent pullbacks encounter increased support showingsellers have lost control and momentum. 2. Building Pressure: diminished volatility and volume creates a reduction of fear among investors and forms a "pressure cooker" effect with growing anticipation. 3. Demand Verification: volume breakout sends a message that supply has been efficiently absorbed and new demand is overwhelming the market upward. Although the VCP is one among several continuation patterns, its construct offers a special benefit in terms of risk control: VCP vs. Cup with Handle: VCP provides a quicker, tighter breakout from a series of contractions, favoring quick, high-momentum trades. Cup with Handle is a longer, broader base that could attract institutional interest for a longer time. Risk Advantage: Because of the clearly defined, tight range of the last contraction, the VCP allows for both a much tighter and easier to manage stop-loss than other patterns such as High Tight Flag or Double Bottom---making it the more preferred lower risk entry setup. Final point For any serious momentum trader, the Volatility Contraction Pattern is an essential tool. It provides a systematic approach to getting aligned with the absolute "best of breed" stocks that typically follow this pattern before making big moves. The main point here: Always look for the VCP in stocks that have solid fundamentals and a clean Stage 2 uptrend. By marrying the VCP's lower-risk entry point with strict stop-loss discipline, you're obtaining a tremendous advantage in harnessing the market's biggest moves.The Volatility Contraction Pattern (VCP): A Low-Risk Breakout Blueprint
I. Anatomy of the Volatility Contraction Pattern (VCP)
1. Progressively Smaller Price Contractions
2. Decrease in Volume (Volume Dry-Up)
3. The Pivot Point and Low Supply
II. Trading the VCP: Finding and Executing the Breakout
How to Identify a High-Probability VCP
Executing the Low-Risk Entry
III. VCP Psychology and Comparative Edge
The Psychology of Contraction
VCP vs. Other Bullish Patterns
General
6 min read
The Volatility Contraction Pattern (VCP): A Low-Risk Breakout Blueprint
The Volatility Contraction Pattern (VCP) is the unique chart pattern championed by trader Mark Minervini, with the primary goal of identifying the exact point at which a high-growth stock is ready for a big move.